Recommended metrics and visualization
After setting up metrics collection, which metrics are important to keep track of, and how should you visualize them? Our recommendation is to use Grafana for both easy integration with the data sources (both Prometheus and Elasticsearch are directly compatible with Grafana) and powerful graphs.
Getting started
To get started, PhenixID provides a base configuration of Grafana dashboards that visualize the overall health and load of the system,
as well as useful tools like showing expiration dates of metadata, keystores, and the license. You
can download this configuration together with a Prometheus instance that will work directly out of the box with your PAS installation,
simply by running the docker compose file. To run the file, you need Docker running on your machine.
Dashboards preview
General dashboard
Authentication dashboard
SAML metadata dashboard
Pipes dashboard
Keystores dashboard

Deployment instructions
After unzipping the directory, navigate to the directory and run docker compose up -d to start both Prometheus and Grafana.
For this to work, make sure that metrics are available through Prometheus as described in the introduction article.
Configuration and best practice
Prometheus
Prometheus is configured with basic auth with PAS default metrics username/password values, configure these according to your needs, but
make sure they match with your PAS configuration. Prometheus is also configured to scrape the target host.docker.internal:8443, meaning
it will try to fetch metrics from the host machine running docker, on port 8443. If your docker host is not the same machine that
runs PAS, you need to enter a valid hostname for the PAS machine instead. Editing the port is also possible of course. It is
not recommended to run PAS metrics on a publicly available endpoint, but running on a standard HTTP connection is fine as long
as the /metrics endpoint is not exposed in your reverse proxy. Also, if you are serving metrics over an HTTPS connection
but lack a trusted certificate (which can often be the case in test environments), make sure to configure
insecure_skip_verify: true under the tls_config settings in the prometheus.yml file.
Grafana
The Grafana interface is available at http://localhost:3000, and the default username/password is
admin and password. Grafana is configured to fetch data from prometheus at the url http://prometheus:9090,
so if you deploy the prometheus on another port or outside of docker you will need to adjust this. You may overwrite any
dashboard to fit your exact needs of course, this is only a starting point with some recommended metrics to look at.
If you do, make sure to take a backup before as it will overwrite the file.
Default dashboards
There are 5 dashboards to start out with, one that has an overview over the entire system with a focus on resources and load, and then detailed views for authentication, keystores, pipes, and saml metadata.
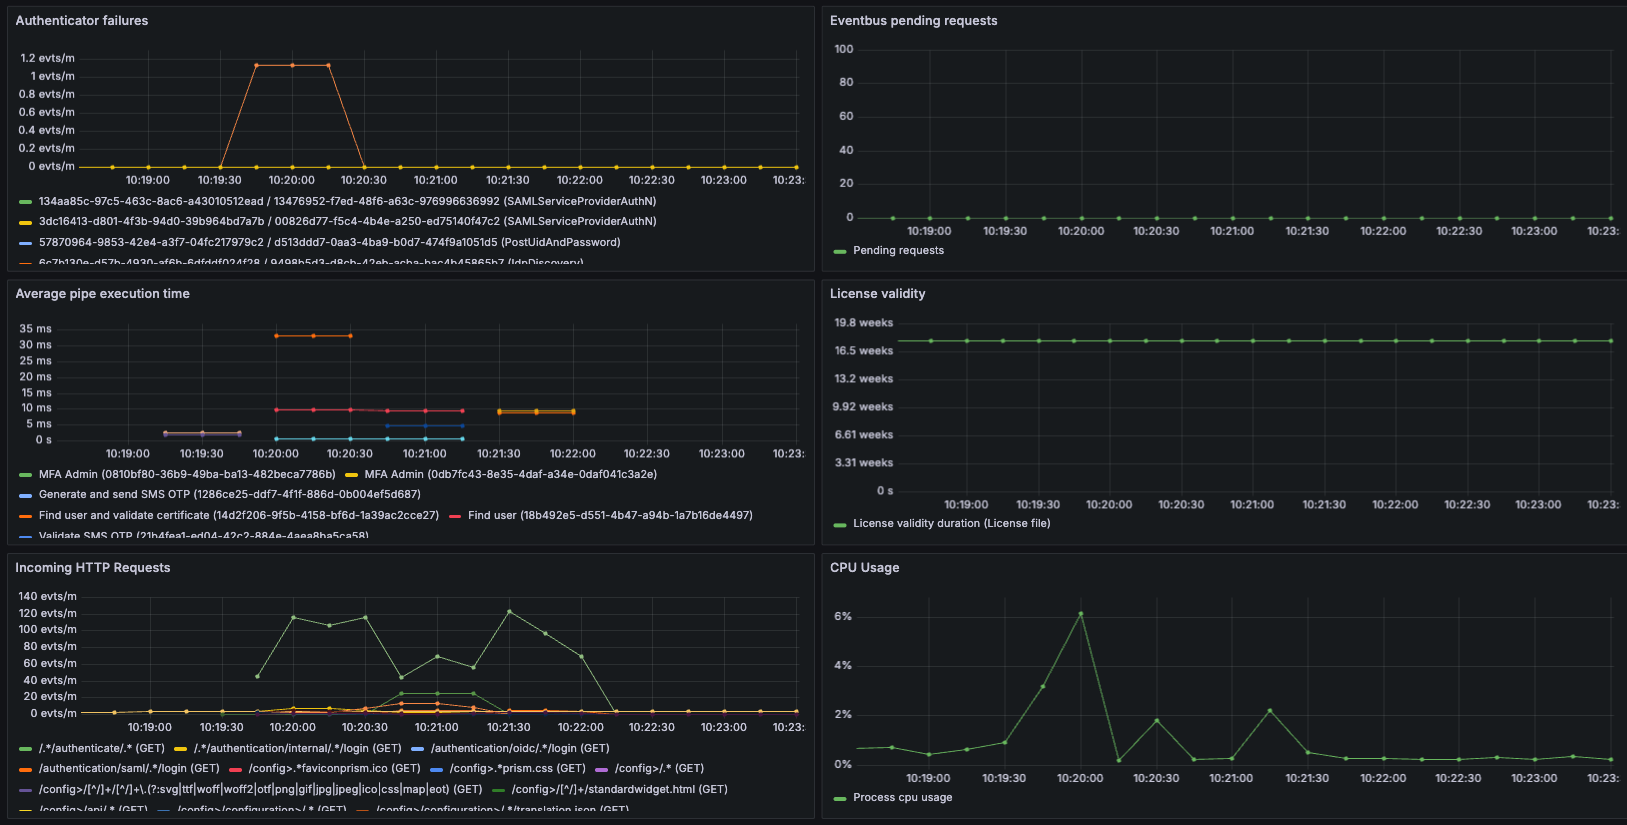
The 'PAS General' dashboard
This is the main dashboard, containing information about the overall health of the system. The available graphs are:
- Available memory -- Shows the amount of available memory. If the value goes below the lower threshold (200 MB) you may want to give the PAS service more memory.
- Memory usage -- A more detailed view of the memory usage by the system
- Java garbage collection -- Shows the GC rate (both paused and concurrent) of PAS. If the paused GC rate goes above the set thresholds (10%-20%) you may want to consider adding more memory to the PAS Service, or investigate the reasons behind it as that amount of GC will severely limit the performance of the PAS server.
- CPU Usage -- The CPU usage of the process.
- Successful authentications -- Shows the rate of successful authentications in PAS (does not include legacy authenticators, for metrics on those you need to look at the Authentication dashboard), split up between SAML IDPs, OpenID Providers, and internal endpoints.
- Authenticator failures -- Shows the rate of authenticator failures. What a "healthy" rate looks like here is completely dependent on the configuration, as this could simply mean the user entered the wrong password or any other harmless failure.
- Keystores expiring within the year -- Just shows the lifespan of the certificates in the configured keystores. Expired certificates should be replaced.
- License validity -- The remaining validity duration of the license. Make sure to replace your license file before it expires to ensure an uninterrupted service, although it will also display an updated validity from the online license check if enabled.
- Average pipe execution time -- The average execution time of pipes when ran successfully. Spikes in this may be of interest when examining performance issues during high load.
- Pipe congestion -- A complex metric that measures (at the exact time of the measurement) the total active duration of unfinished pipes. For example, if there are 100 active pipes that each have been running for 2 seconds at the time of the measurement, the metric will show 200 seconds. This metric is useful to show if pipes are getting congested. If this metric spikes it indicates that the system is likely under high load and is performing poorly.
- Eventbus pending requests -- Requests pending at the event bus. If this metric is spiking during high load it may help to deploy more instances of the module reading from the event bus (which depends on the configuration, but is often the Pipes module, but could also be the HTTP Client module, SAML Module, or something else).
- Incoming HTTP Requests -- The rate of incoming HTTP requests, split up by path and method.
- SAML Module status -- If the SAML module is deployed in a healthy way, see the metric definition for more details.
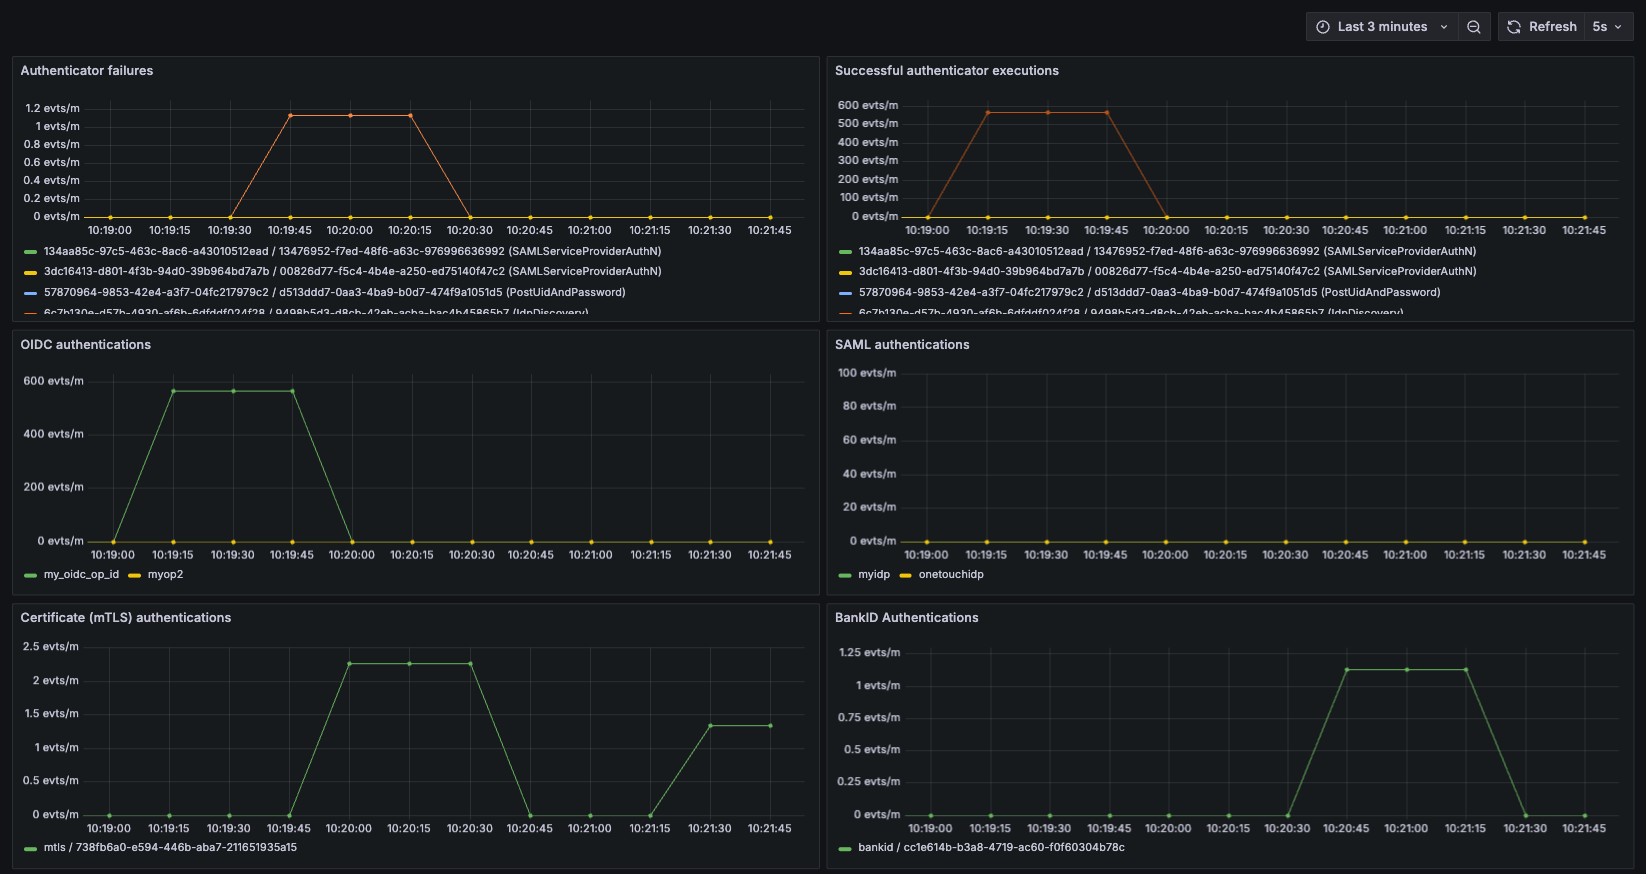
The 'Authentication' dashboard
A more detailed dashboard only showing metrics regarding authentication, available graphs are:
- Authenticator failures -- Shows the rate of authenticator failures. What a "healthy" rate looks like here is completely dependent on the configuration, as this could simply mean the user entered the wrong password or any other harmless failure.
- Successful authenticator executions -- Shows the rate of successful authenticator executions. This includes legacy authenticators, so this would measure complete successful authentications for any legacy setup as well.
- OIDC authentications -- Rate of authentications using the OIDC entrypoint. Same as "Successful authentications" in the main dashboard, but only for OIDC.
- SAML authentications -- Rate of authentications using the SAML entrypoint. Same as "Successful authentications" in the main dashboard, but only for SAML.
- Internal authentications -- Rate of authentications using the internal entrypoint. Same as "Successful authentications" in the main dashboard, but only for internal authentications.
- Certificate / mTLS authentications -- Rate of successful DynamicAuthenticator executions that uses the
"analyticsTag": "mtls"automatically provided in the guide config for mTLS. - BankID Authentications - Rate of successful
BankIDAuthenticatorexecutions (not including legacy BankID authenticators, although that could easily be added to the dashboard manually).
The 'Keystores' dashboard
A dashboard that shows just two graphs:
- Keystore expiration -- Expiration for all configured keystores
- Keystore lookups -- Lookups for all configured keystores
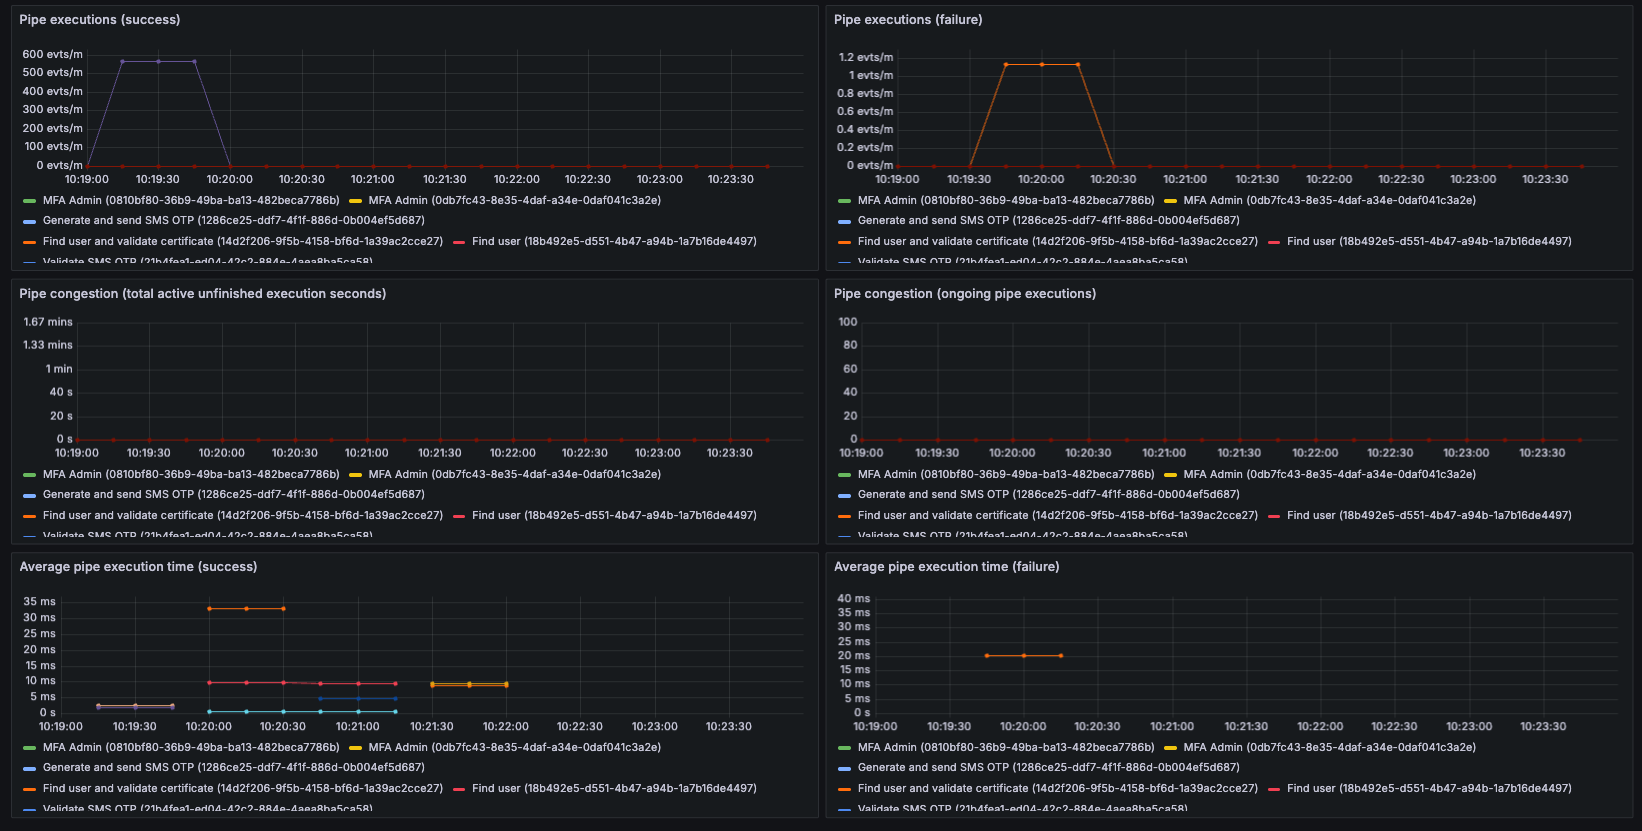
The 'Pipes' dashboard
A more detailed dashboard of pipes showing:
- Pipe executions (success / failure) -- The rate of pipe executions.
- Pipe congestion -- A complex metric that measures (at the exact time of the measurement) the total active duration of unfinished pipes. For example, if there are 100 active pipes that each have been running for 2 seconds at the time of the measurement, the metric will show 200 seconds. This metric is useful to show if pipes are getting congested. If this metric spikes it indicates that the system is likely under high load and is performing poorly.
- Pipe congestion (# of active pipes) -- Same as above, but only shows amount of active pipes.
- Average pipe execution time (success / failure) -- The average execution time of pipes. Spikes in this may be of interest when examining performance issues during high load.
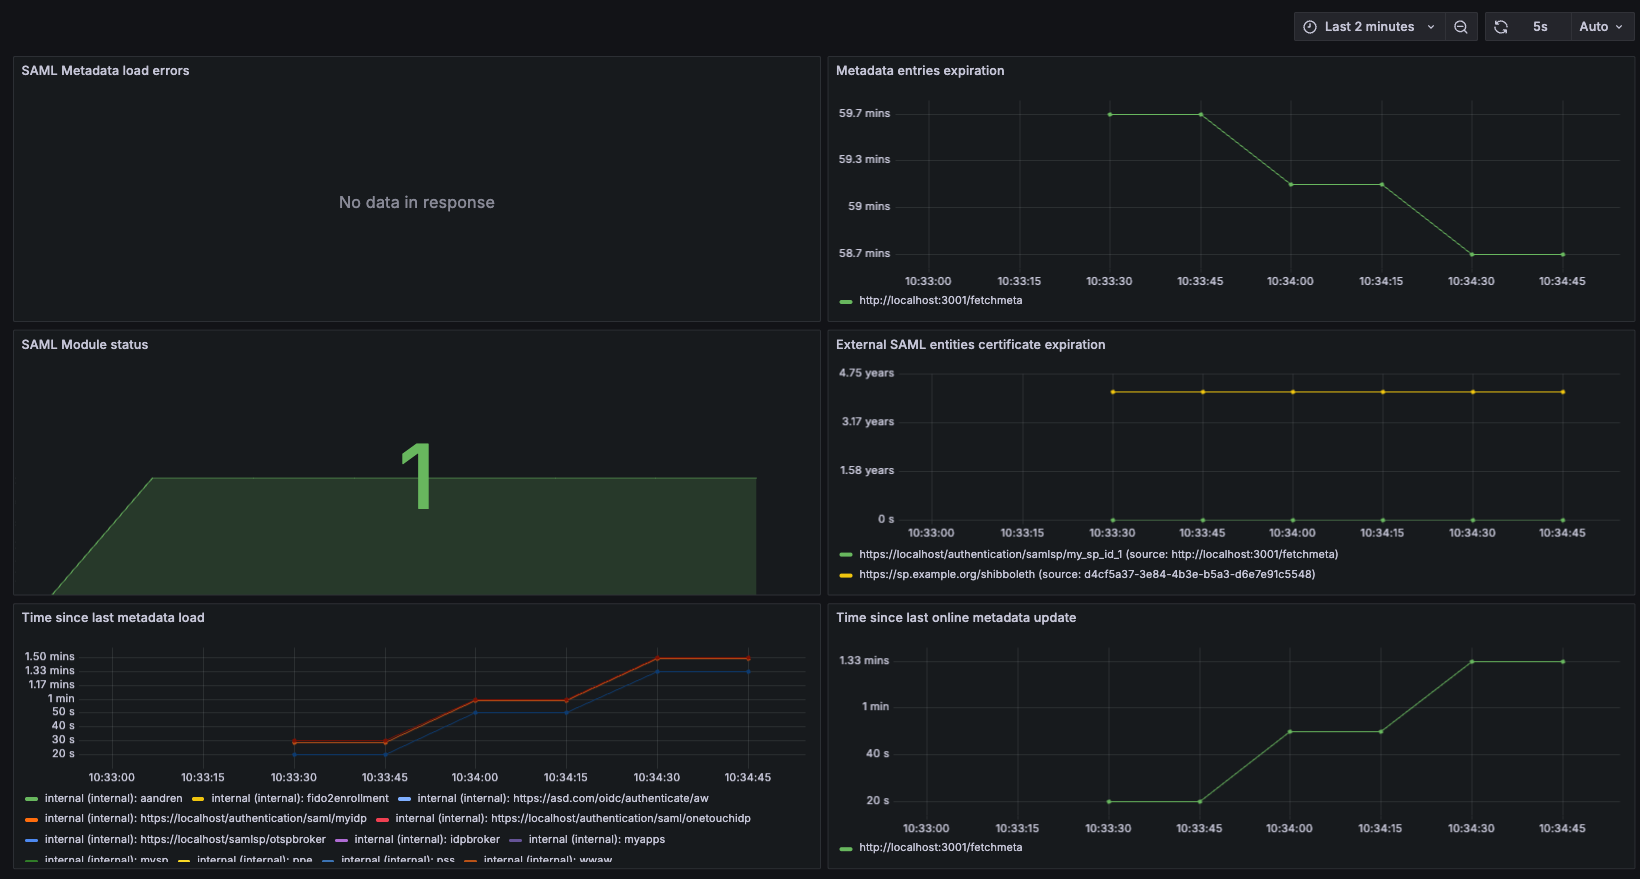
The 'SAML' dashboard
A detailed dashboard of metrics concerning SAML Metadata:
- Metadata load errors -- Shows when and for which URL a metadata load error has occurred.
- Metadata entries expiration -- Shows when metadata entries expire (if they have a ValidUntil date set).
- SAML Module status -- If the SAML module is deployed in a healthy way, see the metric definition for more details.
- External SAML entities certificate expiration -- Shows when the certificates of different entities (IDPs/SPs) expire, and what metadata entry it belongs to, and so on.
- Time since last metadata load -- Shows the time since the last load of SAML metadata. Includes all SAML Metadata loaded by the system.
- Time since last online metadata update -- Shows the time since last successful online metadata update.
Visualization of a high-load test (DOS)
As previously mentioned, the main dashboard focuses on overall health of the system and resource usage / load. Below we can see the what the dashboard shows during a high-load test (high load for the low amount of resources used by the test server). The parameters of the test are:
- A high amount of concurrent users (2000-4000)
- Each user repeatedly logs on via OpenID Connect (looped)
- Each authentication uses an LDAPSearchValve to find the user
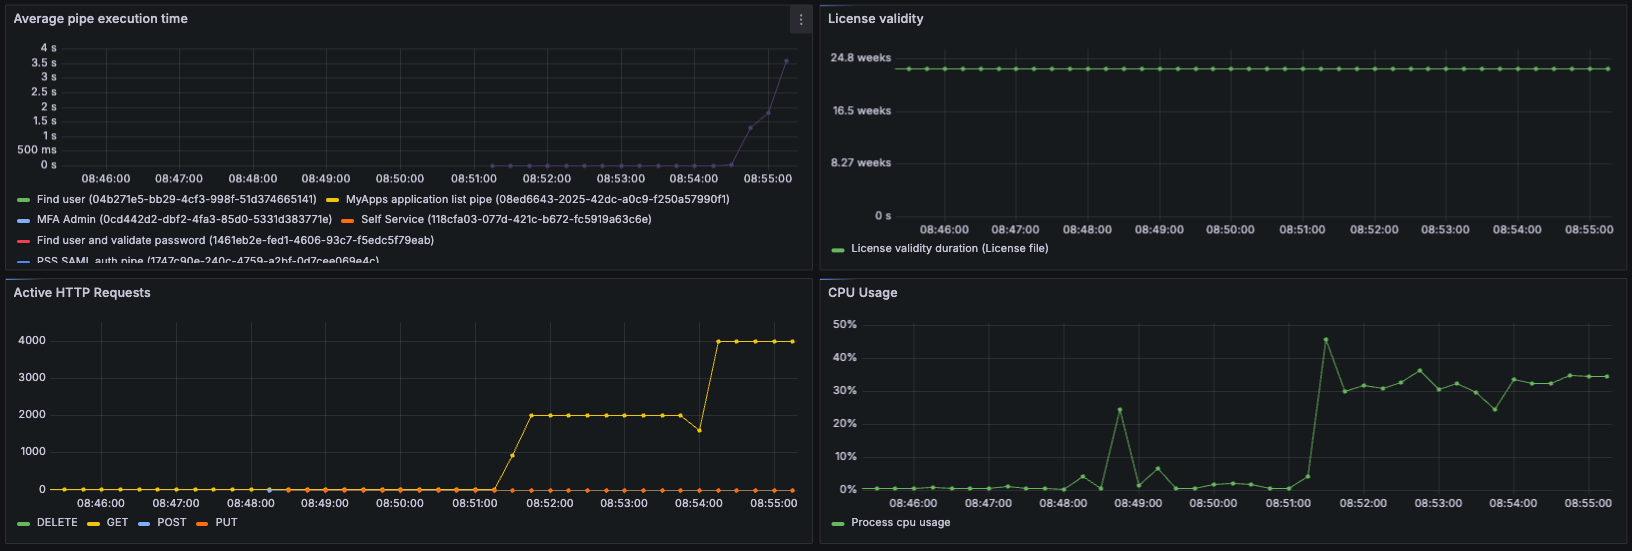
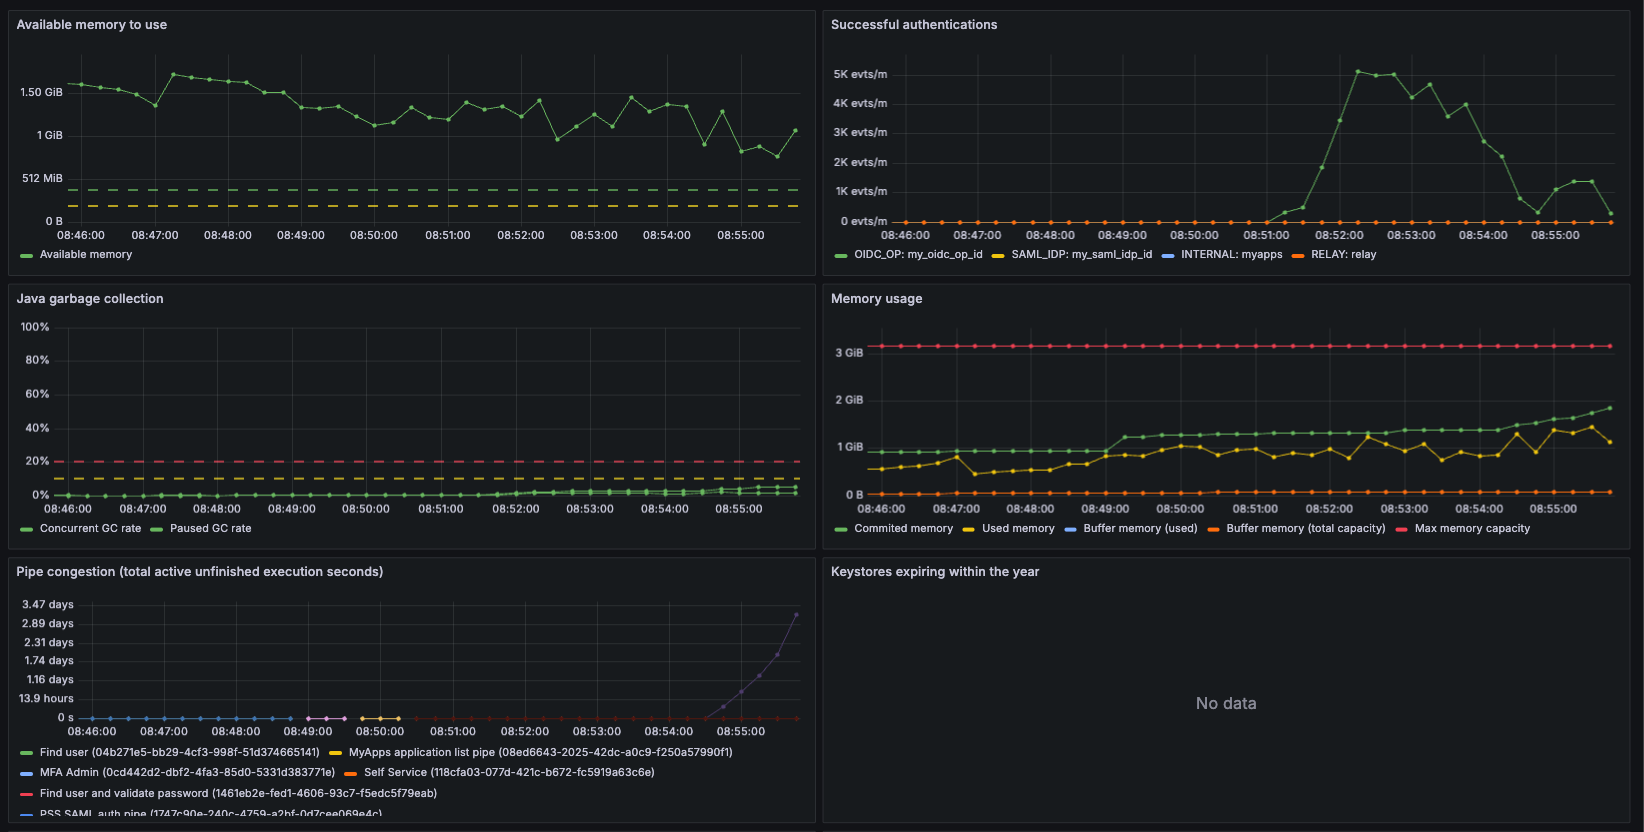
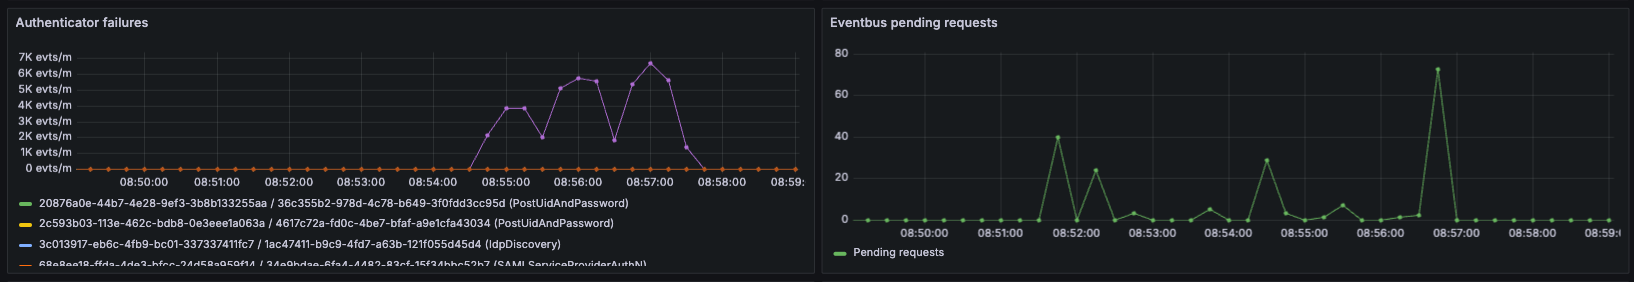
As seen in the graphs, at roughly 08:51 the test starts with 2000 users. Everything is working smoothly under this load, although the CPU is working harder than before. The average pipe execution time is very low, and the rate of successful authentications is high. At 08:54 we up the amount of concurrent users to 4000, and immediately we see that the pipe execution time starts going up. We can see that successful authentications drop, and authentication failures spike. We can also see pipe congestion, meaning that the amount of users stuck in an unfinished pipe at the time of measuring is high. What has happened here is that the LDAP server has overloaded, and requests start timing out and failing.
This is just an example of how useful metrics can be in identifying issues in a PAS deployment. You might even discover a potential problem before it start affecting the end users. By using other metrics, you could discover that your certificates or license are about to run out, that your allocated memory might be too low, or that some SAML metadata has failed to update.