Use a Profiler for troubleshooting a PhenixID application
How to Troubleshoot PhenixID Java Applications Using VisualVM, used for diagnosing performance-related issues when DEBUG or TRACE logs are not sufficient.
System requirements
PhenixID application installed. This works on all java based PhenixID products, PAS, PIM, PIP and SWF
All actions below must be carried out on the server
How to take a Snapshot Using VisualVM
Download VisualVM
Download the latest VisualVM (ZIP file) from:
VisualVM: DownloadDownload a JDK (if not already installed)
VisualVM requires a JDK to run.
We recommend downloading the latest JDK from Azul:
Java 8, 11, 17, 21, 25 Download for Linux, Windows and macOS
Download the ZIP version, extract it to e.g.:
C:\temp\jdkfor windows or/tmp/jdkin LinuxExtract VisualVM
Unzip the VisualVM package to a directory of your choice, for example:
C:\temp\visualvm_<version>or/temp/visualvm_<version>Open Command Prompt
As an administrator (Windows) or a terminal (Linux). In linux you need to be the user root or the user running the process. (sudo su -
) Start VisualVM using the JDK
Launch VisualVM and explicitly point to the JDK you downloaded:C:\temp\visualvm_<version>\bin>visualvm --jdkhome C:\temp\jdkor/temp/visualvm_<version>/bin>visualvm --jdkhome /temp/jdkOn remote Linux, make sure that your X server is running and $DISPLAY variable is set correctly
Locate Running Java Processes
On the left-hand side, VisualVM will list all Java processes it can attach to.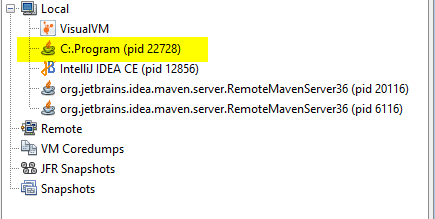
Open the Correct Process
Double-click the process you want to troubleshoot.
If you're unsure which one is correct, compare the Process ID (PID) with Task Manager (Windows) orps -ef | grep java(Linux)Go to the “Sampler” Tab
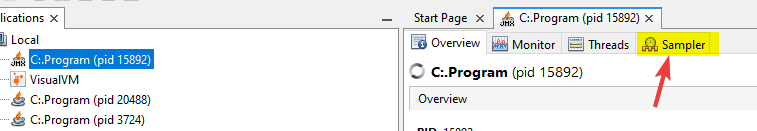
Open the Settings
Check the settings checkbox to show the CPU sampling settings.
Clear CPU Settings
Remove everything in the CPU settings text field so that no filters are applied.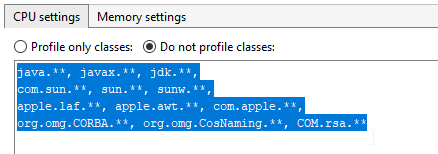
Start CPU Sampling
When you observe the problem in the application, fex unexplained high CPU load, click the CPU button to start sampling.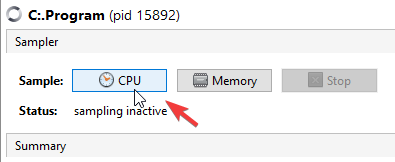
Let It Run Briefly
Let the sampler run for a few seconds during the period of high CPU usage.Stop the Profiler
Click the Stop button to end profiling.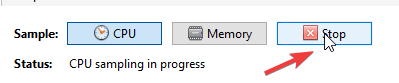
Create a Snapshot
Click the Snapshot button to generate a snapshot of the captured data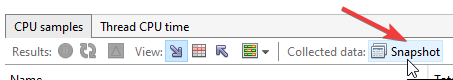
Save and Export the Snapshot
Save the snapshot using the save icon, then select Export Snapshot Data from the menu.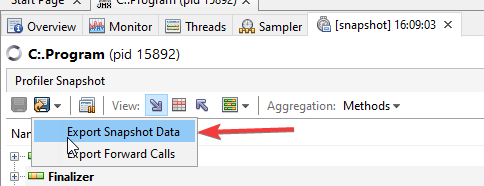
Send Us the .nps File
Provide the exported.npsfile to PhenixID through any suitable method.