Metrics Introduction
Metrics are a simple way to monitor the overall health and performance of PAS. In a nutshell, it is a set of values that represent the current state of the PAS deployment. The way this is used is by connecting a metrics collection tool like Prometheus or Elasticsearch which will measure these metrics and piece them together in a time series database.
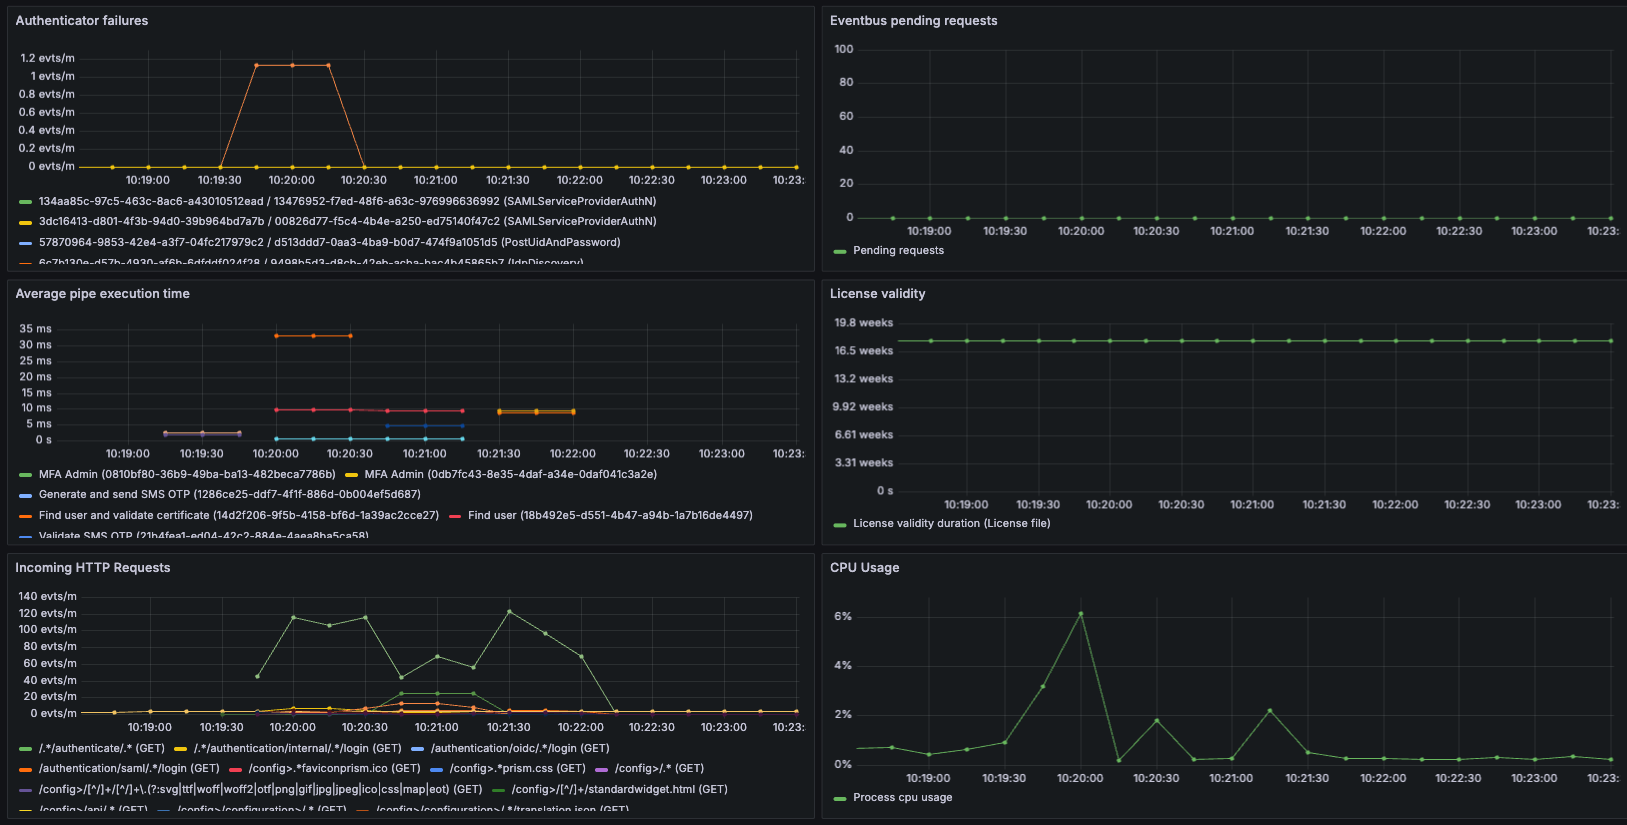
This is then often visualized in real time with tools like Grafana. The end result is real time operations monitoring where you can see e.g. memory usage over time, incoming http requests rate, successful authentication rate, average response times and so on.
An example visualization is the following:
How to enable metrics in PAS
This is described in Metrics Configuration.
Recommended metrics and ready-to-use dashboards
This is described in Recommended metrics and visualization